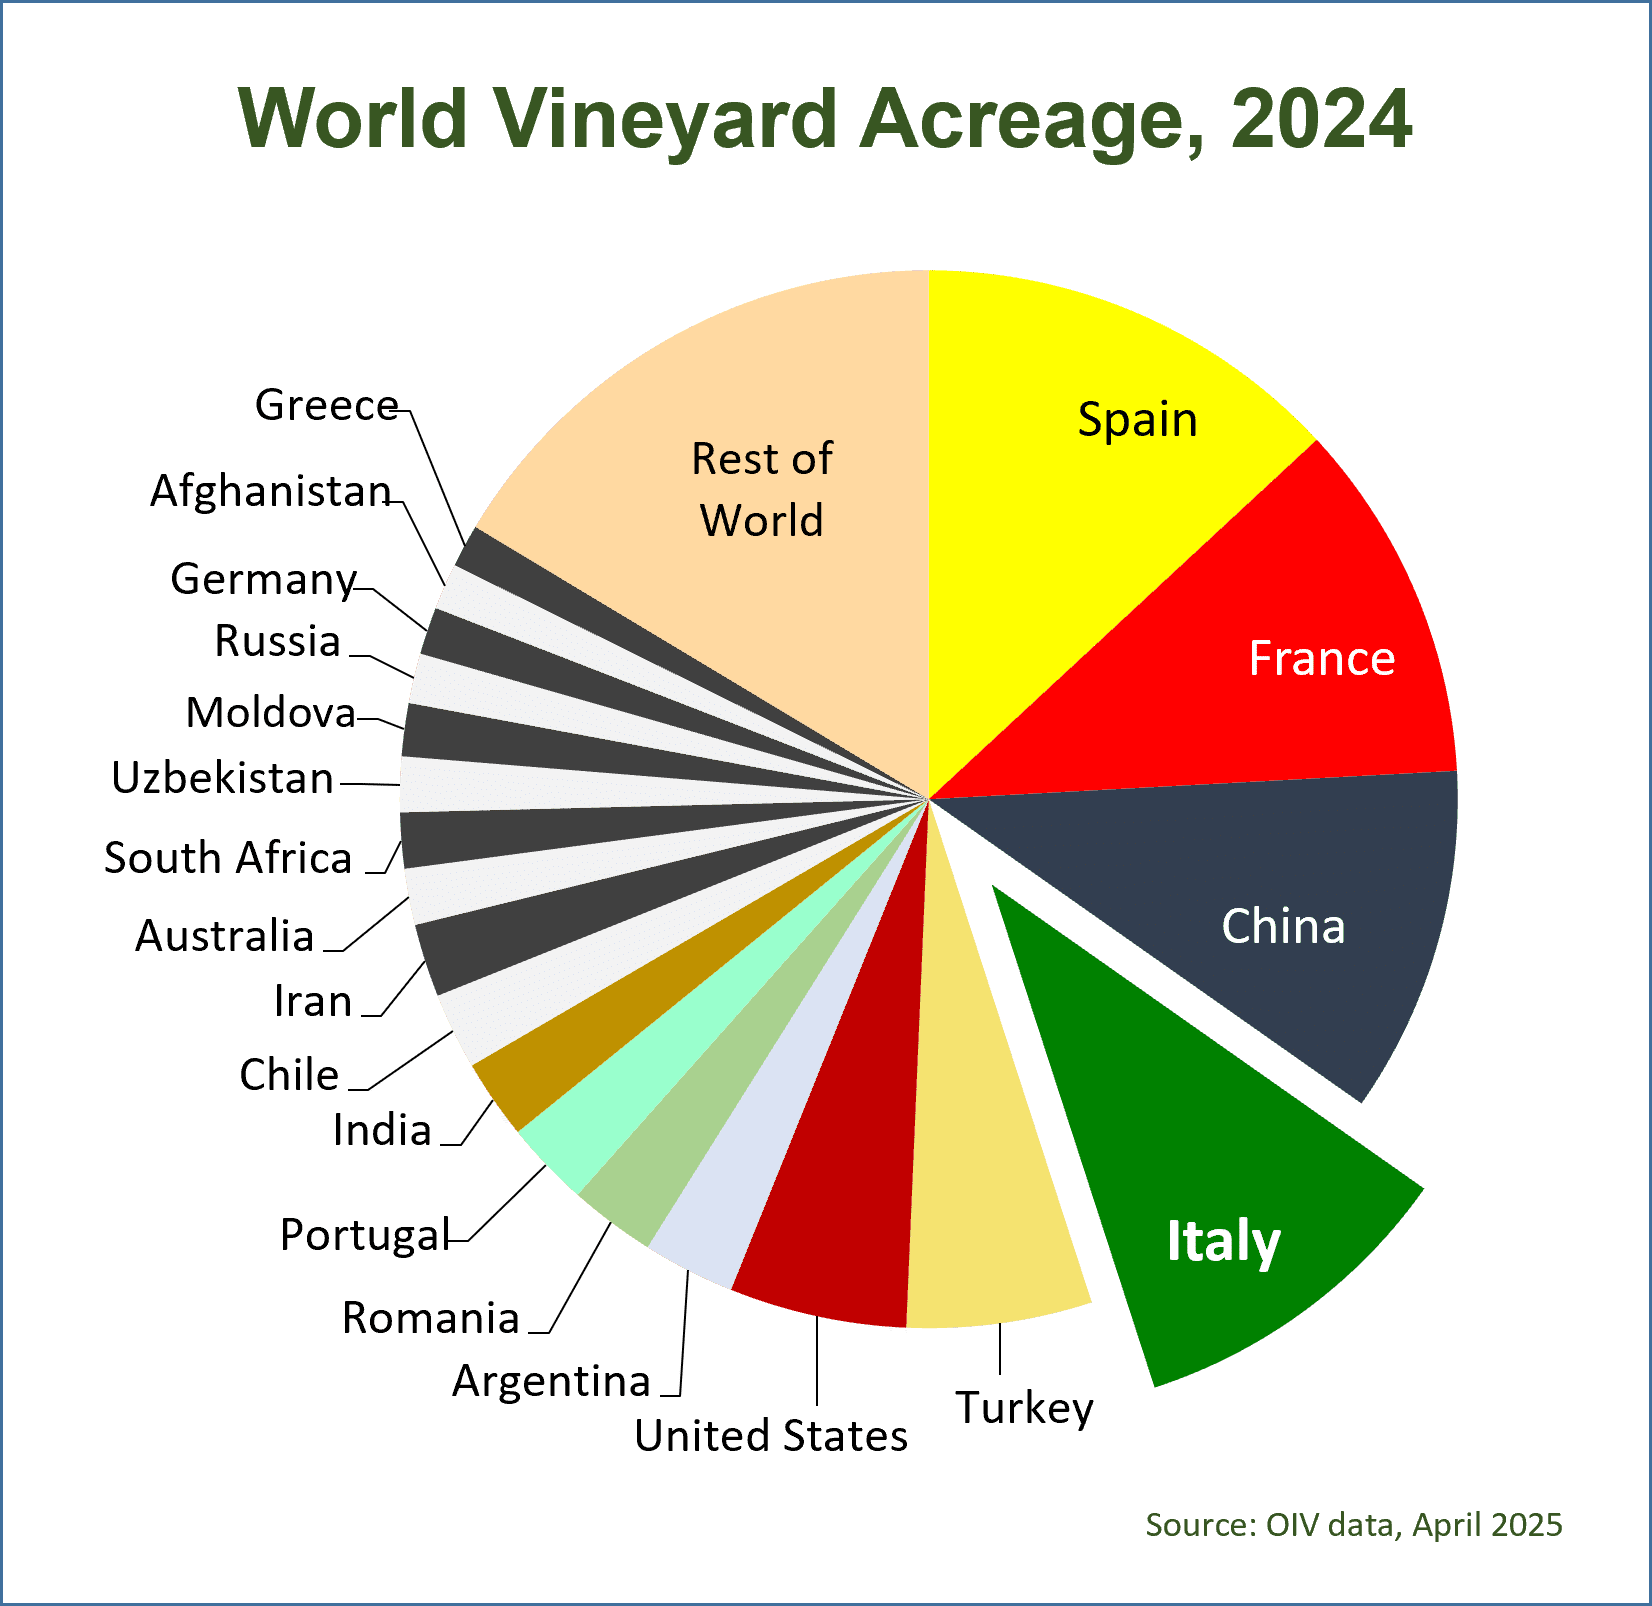
Includes grapes for raisins, juice, and fresh consumption as well as for wine
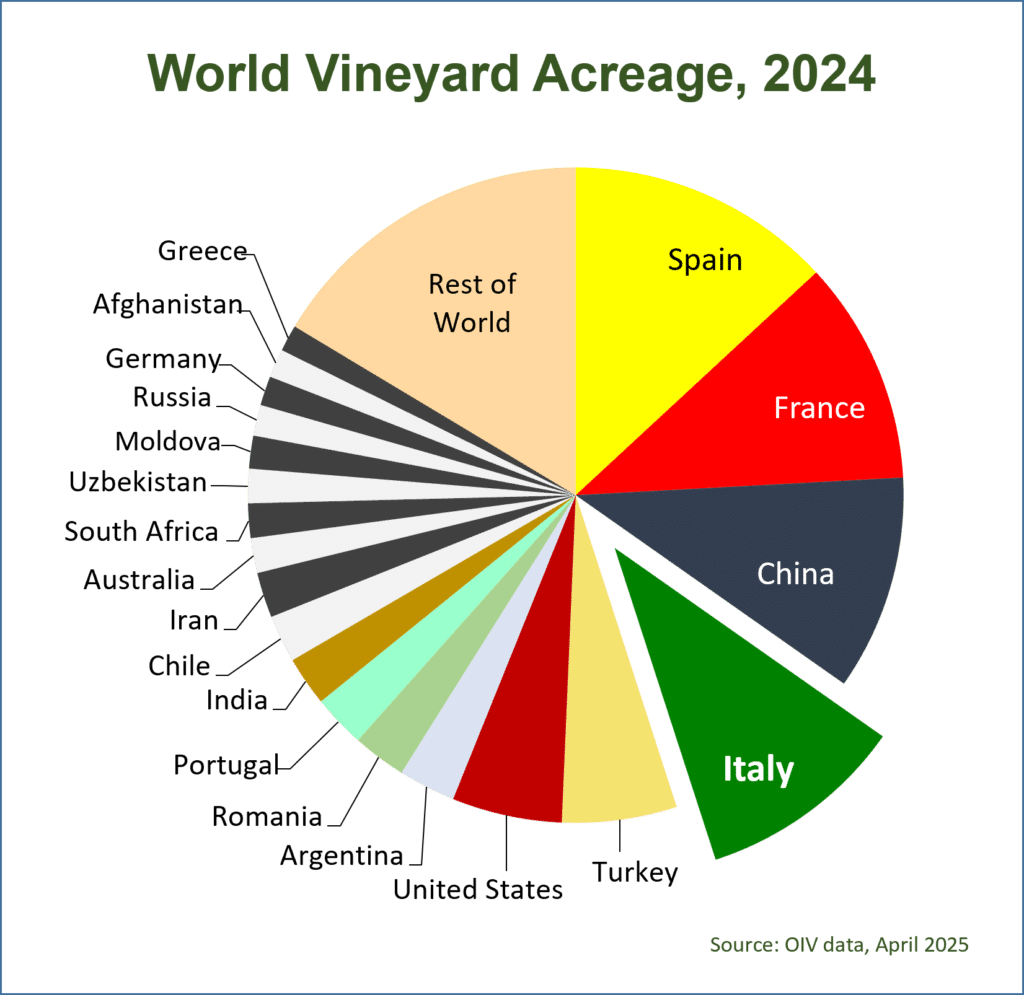
(Vineyard area in thousands of acres)
| Country |
2020 |
2021 |
2022 |
2023 |
2024 |
|---|
| Spain |
2,374 |
2,377 |
2,358 |
2,334 |
2,297 |
| France |
1,973 |
1,965 |
1,966 |
1,946 |
1,934 |
| China |
1,892 |
1,863 |
1,872 |
1,867 |
1,860 |
| Italy |
1,775 |
1,782 |
1,774 |
1,786 |
1,798 |
| Turkey* |
1,065 |
1,036 |
1,021 |
1,003 |
993 |
| United States |
994 |
971 |
966 |
958 |
951 |
| Argentina |
531 |
521 |
511 |
506 |
494 |
| Romania |
470 |
467 |
464 |
462 |
462 |
| Portugal |
398 |
412 |
433 |
450 |
457 |
| India* |
481 |
480 |
478 |
450 |
427 |
| Chile |
512 |
450 |
450 |
425 |
410 |
| Iran* |
393 |
393 |
393 |
393 |
392 |
| Australia |
383 |
336 |
294 |
301 |
301 |
| South Africa |
281 |
291 |
300 |
299 |
299 |
| Uzbekistan* |
317 |
310 |
307 |
301 |
296 |
| Moldova |
346 |
341 |
301 |
284 |
284 |
| Russia |
239 |
245 |
250 |
260 |
267 |
| Germany |
255 |
255 |
255 |
256 |
254 |
| Afghanistan* |
246 |
246 |
247 |
247 |
247 |
| Greece |
277 |
237 |
231 |
227 |
230 |
| Other Countries |
2,970 |
2,924 |
2,900 |
2,886 |
2,873 |
| World total |
18,169 |
17,903 |
17,772 |
17,641 |
17,527 |
* Primarily grapes for fresh consumption or raisins
Source: OIV data, April 2025; 2024 data are preliminary