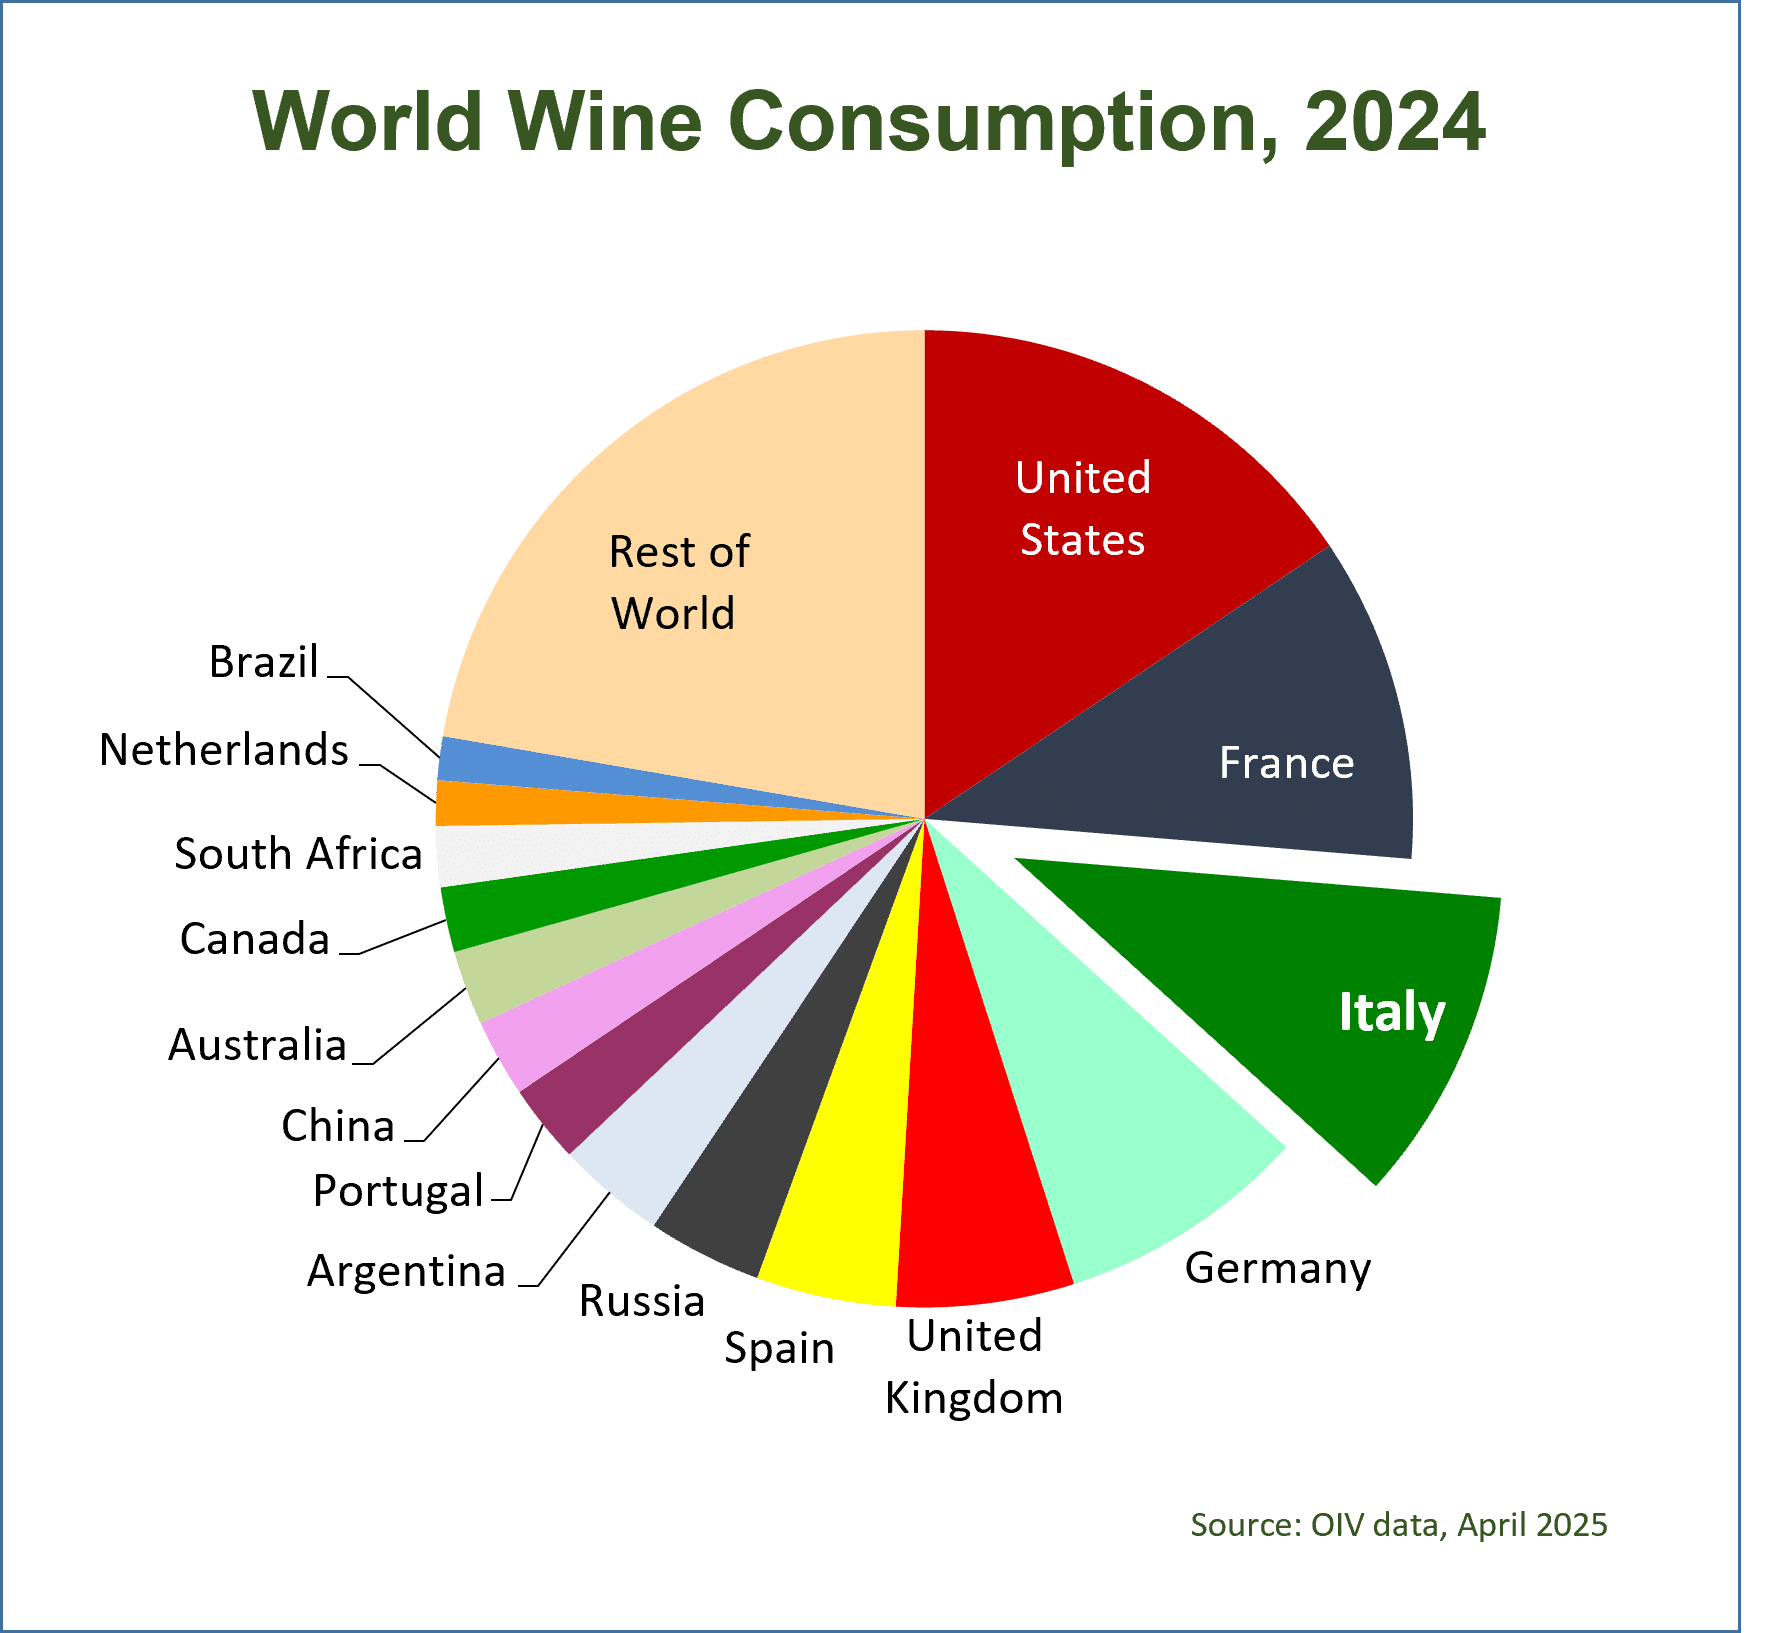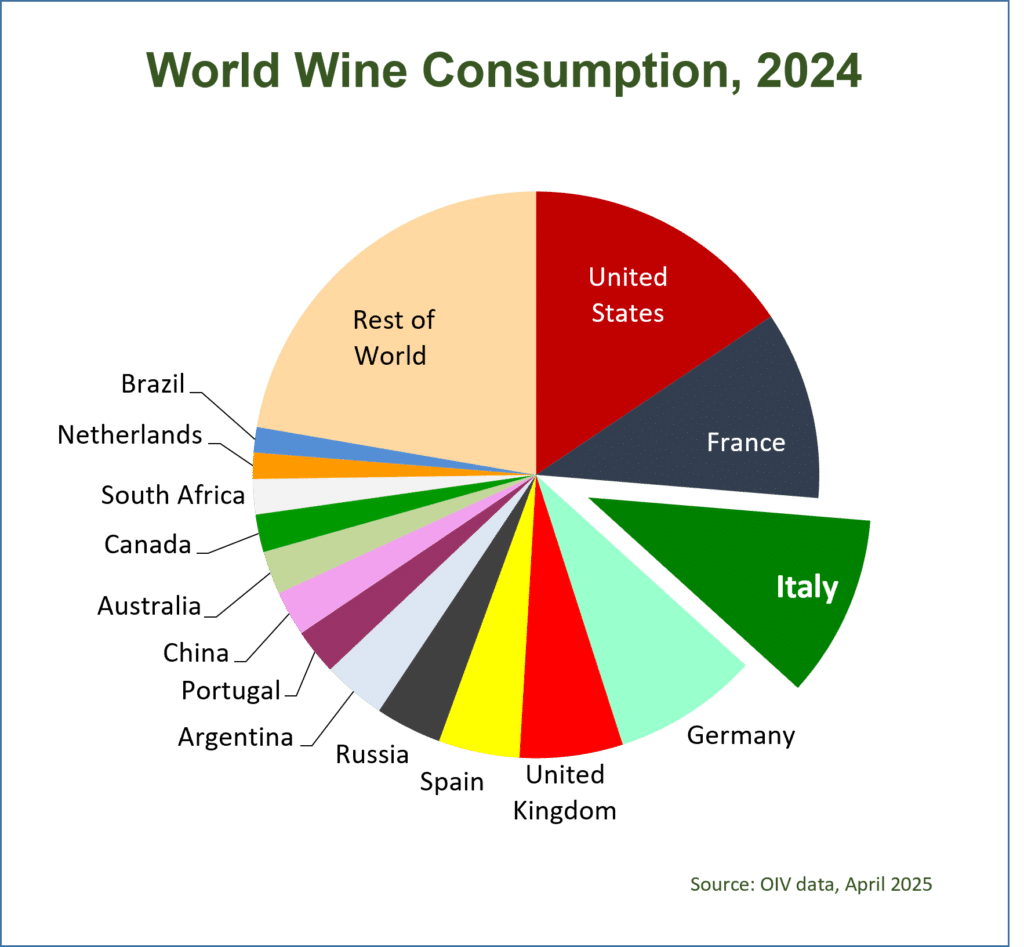
(Volume in thousands of hectoliters)
| Country |
2020 |
2021 |
2022 |
2023 |
2024 |
|---|
| United States |
34,100 |
34,300 |
35,500 |
35,400 |
33,300 |
| France |
23,200 |
24,600 |
24,400 |
23,800 |
23,000 |
| Italy |
24,200 |
24,200 |
22,400 |
22,300 |
22,300 |
| Germany |
19,800 |
19,900 |
19,400 |
18,400 |
17,800 |
| United Kingdom |
13,700 |
13,900 |
13,100 |
12,800 |
12,600 |
| Spain |
9,200 |
10,300 |
9,600 |
9,800 |
9,900 |
| Russia |
7,900 |
8,000 |
8,700 |
7,900 |
8,100 |
| Argentina |
9,400 |
8,400 |
8,300 |
7,800 |
7,700 |
| Portugal |
4,400 |
5,300 |
5,700 |
5,500 |
5,600 |
| China |
12,400 |
10,500 |
9,100 |
6,800 |
5,500 |
| Australia |
6,000 |
5,600 |
5,400 |
5,500 |
5,300 |
| Canada |
5,300 |
5,300 |
5,100 |
4,900 |
4,600 |
| South Africa |
3,000 |
3,900 |
4,500 |
4,400 |
4,300 |
| Netherlands |
3,700 |
3,700 |
3,600 |
3,500 |
3,200 |
| Brazil |
4,100 |
4,100 |
3,600 |
3,500 |
3,100 |
| Rest of world |
51,014 |
52,033 |
50,600 |
49,700 |
47,700 |
| World |
231,414 |
234,033 |
229,000 |
222,000 |
214,000 |
Note: 2024 data are preliminary and some are likely to change in future reports.
Source: OIV data, April 2025